
These set of tools combined represent one of the best solutions to get your logs indexed. It could be your Apache logs, IIS, firewall logs, it doesn’t matter as long as there is a pattern.
The following guide shows in detail how to install and configure these tools in the following scenario:
Note: I learnt myself about how to get all this together starting with this great script I found in GitHub from stephendotexe:
git clone https://github.com/stephendotexe/Logstash_kibana_auto_install.git ~/Logstash_kibana_auto_install
From here we only need the LogStash init script used below.
Let’s start with ElasticSearch installation, here we install version 0.90, feel free to install the latest version found in http://elasticsearch.org/
# Installation
 sudo -s
 wget https://download.elasticsearch.org/elasticsearch/elasticsearch/elasticsearch-0.90.5.deb -O /tmp/elasticsearch.deb
 dpkg -i /tmp/elasticsearch.deb
 rm /tmp/elasticsearch.deb

 # Configutation
 sed -i -e 's/#MAX_OPEN_FILES=65535/MAX_OPEN_FILES=65535/' /etc/default/elasticsearch

 # This is 1/2 the system memory, as recommended by the ES gurus
 sed -i -e 's/#ES_JAVA_OPTS=/ES_JAVA_OPTS="-Xmx4g -Xms4g -Des.index.storage.type=memory"/' /etc/default/elasticsearch
 # Start
 /etc/init.d/elasticsearch start
After this ElasticSearch should be available in http://localhost:9200. Lets configure Apache in front of it. Not showing how to install Apache but it is “apt-get install apache2” 😛
You need this because:
In Apache this is very simple:
ProxyPass /elasticsearch http://localhost:9200
ProxyPassReverse /elasticsearch http://localhost:9200
Once you have configured this you should be able to reach ElasticSearch using http over port 80:
– Status: http://…/elasticsearch
– Index list: http://…/elasticsearch/_aliases
ElasticSearch works sending http request, using REST, example to delete an index:
ubuntu@myserver:~$ curl -XDELETE 'http://localhost:9200/logstash-2013.10.24'
{"ok":true,"acknowledged":true}
This is another reason you might want to protect ElasticSearch from the outside, otherwise anyone could delete your indexes or do other nasty things.
Full reference: http://www.elasticsearch.org/guide/en/elasticsearch/reference/current/
LogStash installation is very easy:
# Logstash is just a jar and requires some additional configs
LOGHOME=/etc/logstash
mkdir $LOGHOME
pushd $LOGHOME
wget https://logstash.objects.dreamhost.com/release/logstash-1.1.13-flatjar.jar -O logstash.jar
cp ~/Logstash_kibana_auto_install/init/logstash.conf /etc/init/
mkdir /var/lib/logstash # Required working directory for logstash
service logstash start
popd
You might want to edit LogStash startup parameters: http://logstash.net/docs/1.2.2/flags
LogStash is a service that parses logs, this is, it monitors files to read, like a growing local log file, or listens in a TCP port waiting to receive log lines. LogStash process the logs on arrival an then it inserts them in a database.
The purpose of LogStash in this case is for to read some log files in the local file system, process them to identify each field in each line, and then insert them in ElasticSearch.
The type of logs we are processing here are similar to the standard Apache combined logs, but with more fields. Because of this we need to configure a pattern match, this is what LogStash will use to process each line and enter into ElasticSearch the data in the right format. Finding that right pattern is where the real fun is :P. I hope my example helps you.
LogStash uses grok to parse the logs:
– Documentation: http://logstash.net/docs/1.2.2/filters/grok
– Patterns: https://github.com/logstash/logstash/blob/v1.2.2/patterns/grok-patterns
– You can test match filters here: http://grokdebug.herokuapp.com/
Important: LogStash inserts in the database what it processes and it automatically inserts for each entry a timestamp. The thing is your logs will probably have a timestamp, and you want to search by the date contained in these logs, not the date they were processed. To use the timestamp from the parsed logs, this is to use the date+time within each line of the log file itself, you need to use a filter which is documented here: http://logstash.net/docs/1.2.2/filters/date
input {
# tcp {
# type => "apache"
# port => 3333
# }
file {
    path => [ "/mnt/logs/access.log/web-1.log", "/mnt/logs/access.log/web-2.log" ]
    type => "apache"
    # This is the DB that controls what was a the last line read in a file
    sincedb_path => "/home/logstash/sincedb_apache"
}
}
filter {
    if [type] == "apache" {
    grok {
        # Saved pattern COMBINEDAPACHELOG doesn't work in case of custom logs
        # match => { "message" => "%{COMBINEDAPACHELOG}" }
        match => [ "message" , "(%{IPORHOST:client_ip}|-) %{USER:ident} %{USER:auth} \[%{HTTPDATE:timestamp}\] \"(?:%{WORD:verb} %{NOTSPACE:request}(?: HTTP/%{NUMBER:httpversion})?|%{DATA:rawrequest})\" %{NUMBER:response} (?:%{NUMBER:bytes:int}|-) %{QS:referrer} %{QS:agent} vhost=%{NOTSPACE:vhost} host=%{NOTSPACE:host} hosting_site=%{NOTSPACE:hosting_site} request_time=%{NUMBER:request_time:int}" ]
    }
    date {
        # Try to pull the timestamp from the 'timestamp' field (parsed above with
        # grok). The apache time format looks like: "18/Aug/2011:05:44:34 -0700"
        # match => { "timestamp" => "dd/MMM/yyyy:HH:mm:ss Z" }
        match => [ "timestamp" , "dd/MMM/yyyy:HH:mm:ss Z", "ISO8601" ]
    }
}
}
output {
    elasticsearch {
        host => "127.0.0.1"
    }
}
As you can see LogStash simply checks the logs that are in /mnt/logs/access.log/. In my case, due to access limitations, I can only read the logs of the servers I want to index over SSH, so I sync them every minute to a local copy.
sudo mkdir -p /mnt/logs/access.log/
sudo chown -R ubuntu:ubuntu /mnt/logs/

vim /home/ubuntu/logs_sync.sh
#!/bin/bash
rsync --append [email protected]:/var/log/apache2/access.log /mnt/logs/access.log/web-1.log
rsync --append [email protected]:/var/log/apache2/access.log /mnt/logs/access.log/web-2.log
Note the “–append” option, that is important.
Finally mention that in my case the servers with the logs have an standard Linux rotation in which the logs are always named “access.log” and the file is truncated every day in each server.
Because “rsync” will fail continuing appending to a big file after the source file has been truncated (source smaller than destination file), the trick is to delete the local copy of access.log shortly after the rotation has happened in the source server. Rsync will then start again for the day and LogStash will reset the counter after finding a smaller file.
crontab -e
# This runs every minute
* * * * * /home/ubuntu/logs_sync.sh 2>&1 > /dev/null
# This removes the local access.log as around 6:25 UTC the access.log in the web servers is truncated. We remove the file locally otherwise rsync skips the transfer as the destination file is bigger than origin (because we have to use "--append" option)
00 7 * * * /bin/rm /mnt/logs/access.log/* 2>&1 > /dev/null
Kibana aka Kibana3, This is the front end to Elasticsearch.
Use any web server and put the static files in /var/www/.
In config.js the URL path to Elasticsearch needs to be available from the web, hence the Proxy defined above.
config.js
elasticsearch: "http://"+window.location.hostname"/elasticsearch",
Finally create the index in ElasticSearch for Kibana3 to save its settings:
curl -XPUT 'http://localhost:9200/kibana-int'
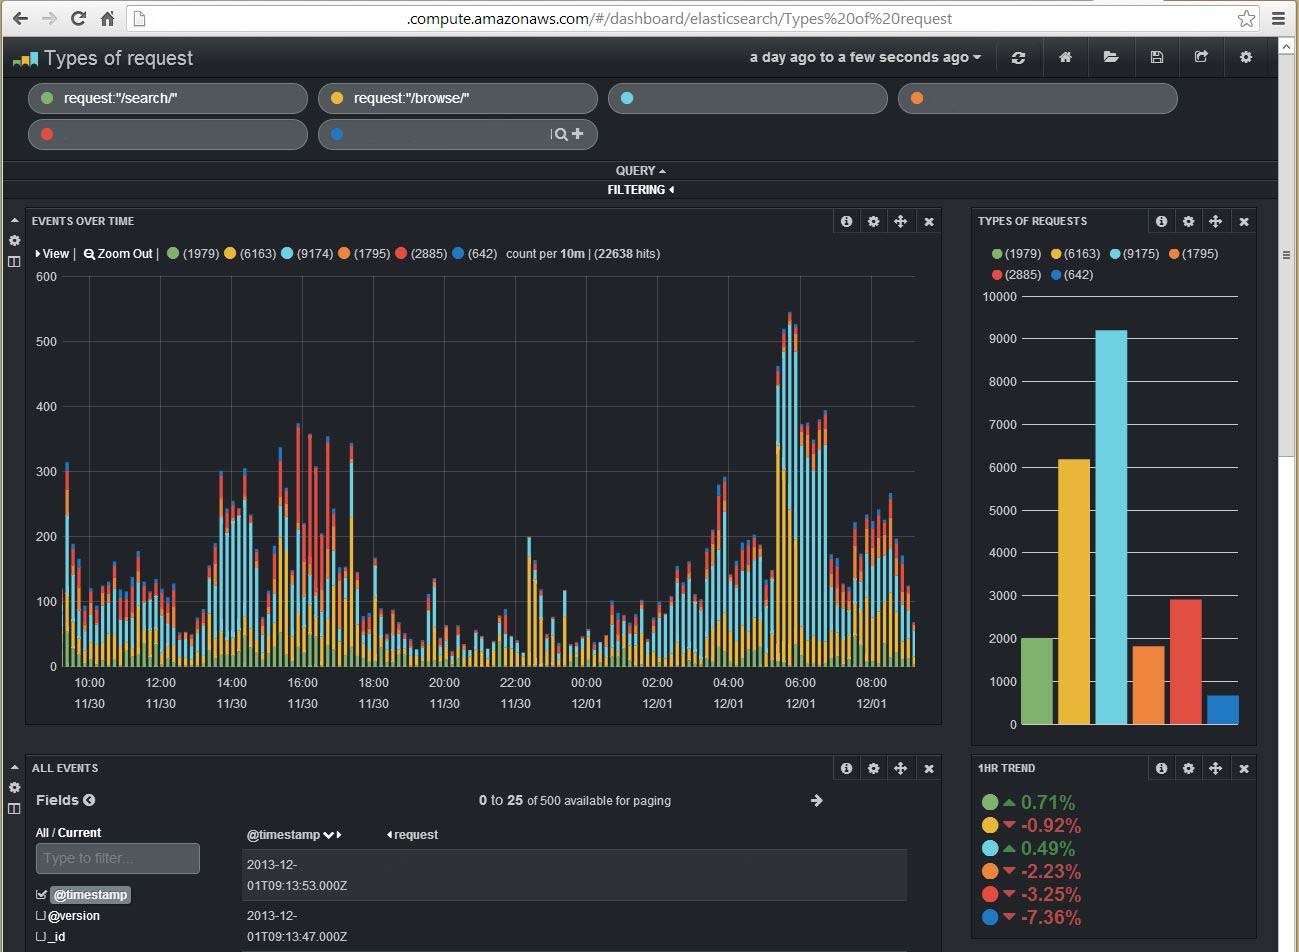
Once all installed and the logs are processed the queries and the information you can get from this is almost endless. In Kibana3 you can make any search ElasticSearch support, and these are Lucene based queries. You can combine them to do amazing reports in and graphs in a very customisable front end. Things like:
– Types or requests (colouring each type in a combined graph)
– Find things like all the users which requests had a JPG, used Safari, took more than 2 seconds to download, hit server number, and during 2pm to 3pm… all in seconds.
Screenshot:
Leave a Reply